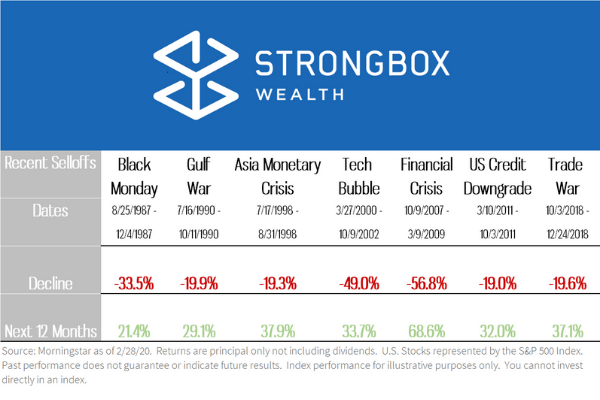
Serving as a dose of perspective, this chart displays significant U.S. stock market selloffs over the last 30 years and resulting performance a year later. Enduring the unknown during this downturn can be a challenge. As always, we’re here to discuss any concerns and review your investment plan.
brenden ellis
Brenden Ellis is a Wealth Advisor at StrongBox Wealth, where he works with individuals, families, and business owners to make thoughtful financial decisions with clarity and confidence. His work centers on retirement planning, tax-aware investment strategy, and long-term wealth planning, helping clients align their financial resources with their personal and professional goals.
A native of Lee’s Summit, Missouri, Brenden began his career in 2021 in Commerce Bank’s commercial lending training program. He later became a Healthcare Relationship Manager in Kansas City, specializing in physician practices. Through that role, he gained deep experience in physician equity structures, practice financing, and real estate lending. Working closely with medical professionals shaped his understanding of the complex financial lives of high-earning specialists and ultimately led him to transition into private wealth advising.
Brenden earned his Bachelor of Science in Finance from Iowa State University. He currently serves on the Board of Directors for Saint Luke’s East Hospital and lives in Prairie Village, Kansas with his wife, Nicole, and their dog, Theo.
Outside of work, Brenden enjoys racing triathlons and other endurance events, along with cheering on the Kansas City Chiefs and Iowa State Cyclones.
Certified Financial Planner Board of Standards Center for Financial Planning, Inc. owns and licenses the certification marks CFP®, CERTIFIED FINANCIAL PLANNER®, and CFP® (with plaque design) in the United States to Certified Financial Planner Board of Standards, Inc., which authorizes individuals who successfully complete the organization’s initial and ongoing certification requirements to use the certification marks.