THE MAGNIFICENT 7
Much has been written and discussed in various market and economic analysis circles this year around the massive AI paradigm shift. Many prominent CEOs and leaders in academia are embracing a new age of innovation and signaling the need for a completely new perspective on our future global workforce. No doubt there are heavyweight companies behind this technological revolution and most of those names are easily recognized by even the most casual observer. This heralded group of mostly technology companies focused on AI, cloud computing, hardware, and software has been coined “The Magnificent 7” includes Apple, Microsoft, Google (Alphabet), and Amazon, Nvidia, Meta (Facebook), and Tesla.
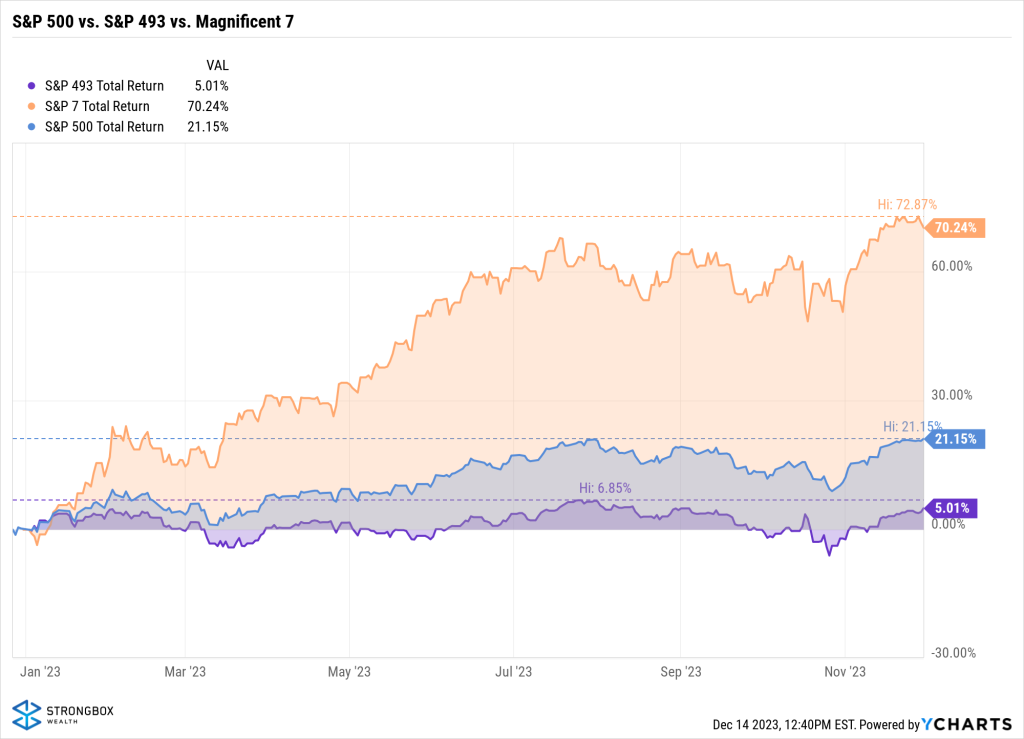
The Magnificent 7 has specifically powered the S&P 500’s positive performance this year. As the chart illustrates, through November 30th market close the collective performance of this group is up an astounding 70.24% while the S&P 500 index is up 22.64%. However, the remaining 493 stocks of the S&P 500 are up 5.01%. This is a highly atypical phenomenon; rarely has only a handful of companies been so responsible for such outsized performance disparity in the U.S. stock market. This narrow market leadership is impressive in its effect but masks the underlying fact that the clear majority of U.S. largecap stocks have not been along for the ride this year.
In addition to its unusually high 2023 performance return, the Magnificent 7’s concentration within the U.S. S&P 500 is distinctly important, as nearly 30% of the entire index weighting is attributed to these seven companies! For perspective, as CNBC noted earlier this year “Not only is Apple bigger than all 595 companies that list in the United Kingdom, it’s bigger than all the companies in France (235 companies), and India (1,242 companies). Apple is twice the size of Germany’s entire stock market, with 255 companies.” In other words, the size and scale of these companies within the S&P 500 index are both immense and unprecedented.
Reflecting on both the innovative strengths and broader dynamics of the stock market, consider this additional context:
Pros of Concentration in “Magnificent 7” Stocks
Innovation Leadership: These companies are at the forefront of technological innovation, especially in AI, cloud computing, and consumer electronics. Their historical growth and increasing market dominance are testaments to their ability to both create and adapt.
Economic Influence: The Magnificent 7 wields significant influence over the U.S. economy. Their investment decisions, research, and product development often set trends for entire industries.
Investor Confidence: The outsized performance of these tech giants appears to have provided a stabilizing force in the market, offering confidence to investors, especially in this economic era of high inflation, market volatility, and geopolitical unrest.
Cons of Concentration in “Magnificent 7” Stocks
Market Risk: Overreliance on a few large companies can lead to increased market volatility. If one or more of these companies face material setbacks, it could disproportionately impact market sentiment.
Innovation Tunneling: While these companies are innovation leaders, there’s a risk that the market could become too focused on their specific areas of innovation, potentially overlooking or underfunding other important sectors and technologies.
Obsolescence: History is littered with examples of once dominant technology companies that lost their leadership advantage as more nimble innovative companies surpassed them. This form of corporate Darwinism is essential to remember when owning common stock that is priced today on future expected earnings many years out.
Balancing the Equation
As investors, it’s crucial to appreciate and approach these stocks with a balanced perspective. While they represent significant innovation and growth potential, there’s also increased risk due to their high stock price valuations coupled with very lofty expectations that essentially presume several years’ worth of significant earnings growth and strategy execution. Thus, diversification remains paramount, not just across different sectors but also by considering emerging companies that might be tomorrow’s leaders. Risk is mitigated by complementing ownership with a balance of different sectors and asset classes. Overreliance and concentration of one’s portfolio on “hot” themes has historically resulted in disappointment. Thus, it is with balanced enthusiasm that we embrace judicious ownership of today’s dominant innovation companies into client portfolios.
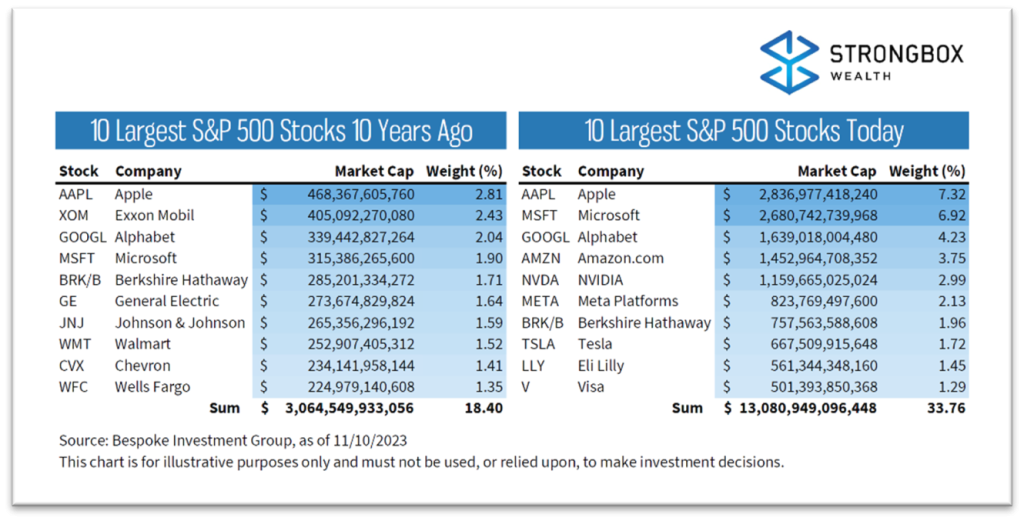
The market itself is dynamic. New companies rise and industries evolve. Today’s leaders might not hold the same position in the next decade, as shown time and again through the history of obsolescence. For example, only four of The Magnificent 7 companies were among the top ten in market capitalization a decade ago. What thrives today may not necessarily hold the same relative position in the future.
Note that the top 10 companies in 2013 comprised just 18.4% of the overall market’s weighting, collectively worth 3 trillion dollars, and included just three technology companies. By contrast, the top 10 companies today represent a highly concentrated 1/3 of the S&P 500’s total value, clocking in at over 13 trillion dollars and including all The Magnificent 7 companies!
a bond market headwind reprieve
We have written about distinct and consistent bond market headwinds over the last many client commentaries. On the heels of 2022 being the worst bond market performance ever, 2023 has not offered much reprieve. As interest rates have risen throughout most of this year, alongside U.S. economic growth remaining well above the Federal Reserve’s targeted 2% inflation mandate, bond prices have been stubborn to reverse trend until November. Though the Fed’s ongoing “higher-for-longer” mantra continues to backstop expectations that interest rates will be cut anytime soon, sentiment changed, rates fell, and November posted the best monthly bond market return in 30 years. The December 12th consumer price index (CPI) report showing a 3.1% year-over-year increase in consumer prices seems to confirm that inflation is moderating albeit above the Fed’s 2% mandate. Accordingly, expectations for continued rate hikes are rapidly fading. Investor sentiment changes often provide inflection points and prove in hindsight to be crucial elements to enabling market reversals. It remains important to look beyond short-term volatility. Until recently, the declines in bond values reflected the market’s anticipation and reaction to the Federal Reserve’s tightening policy, which has been the most rapid since the early 1980s. While this has caused some discomfort by experiencing back-to-back down years in the fixed income market through October, history suggests that bond markets recover and stabilize over time.
The upcoming chart reveals an intriguing aspect of bond market behavior over time by illustrating the Bloomberg U.S. Aggregate Bond index’s intra-year declines (red dot) and year-end calendar performance returns (gray bars). It shows that despite average intra-year bond price declines of 3.3%, the annual returns have remained positive in 42 out of 47 years. Notably, it demonstrates that even though the bond market experiences fluctuation within a given year, it has historically finished the year on a positive note most of the time.
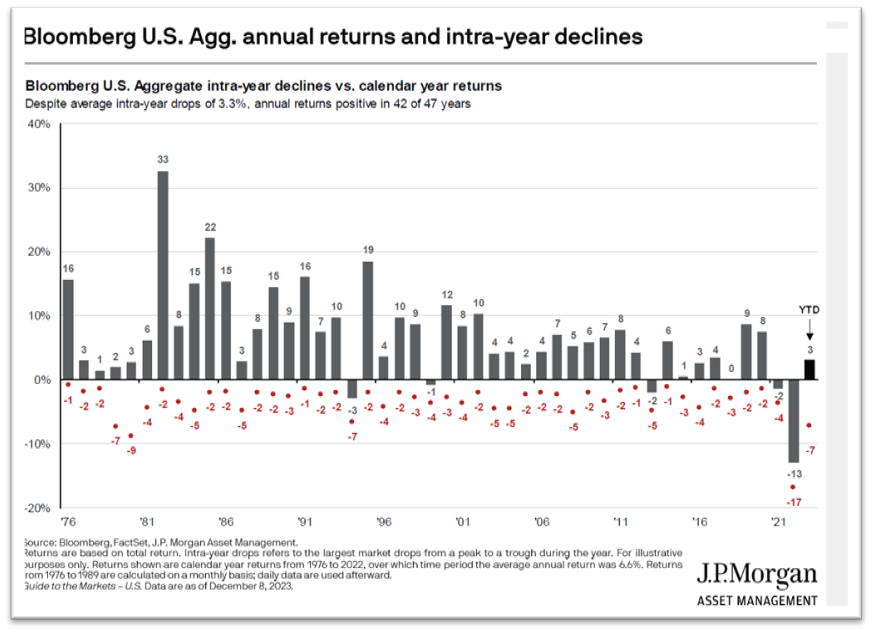
If we observe signals from the Federal Reserve that we’ve approached the peak of this tightening cycle (no further rate hikes) this indicates that the most significant pressures on bond prices are behind us. When interest rates stabilize or decline, bond prices typically recover and potentially lead to positive returns.
Investment strategies should always be based on a long-term perspective. The bond market’s track record of resilience, as shown in the JP Morgan chart, is a reminder that patience and maintaining a well-diversified portfolio serve investors well in weathering economic cycles. One significant and positive takeaway from the bond market sell-off over the last two years is that interest rates are now elevated to high yield levels not seen since 2007. StrongBox Wealth has been actively positioning portfolios to participate in these improved yields and benefit from realizing a materially higher amount of portfolio investment income.
Looking Forward
As we assess the investment and economic landscape, especially in light of recent market developments now materialized as concentrated stock market leadership and volatile interest rate movements, it is important to share perspective on historical market performance during various stages of the Federal Reserve interest rate cycle. The chart next provides stock and bond market average returns at three distinct points in the Fed’s five interest rate cycles since 1990.
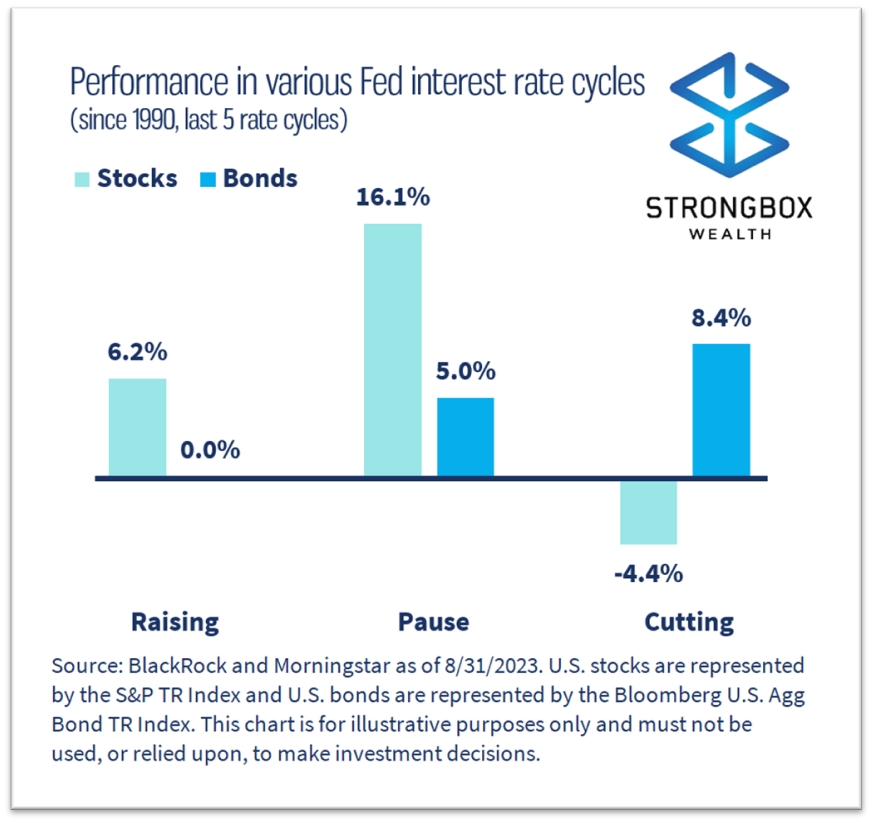
During the “Raising” phase, as the Fed increases rates to manage economic growth and inflation, bond prices generally fall, which is reflected in the 0.0% return for bonds. However, stocks have shown resilience with an average 6.2% return, despite typically facing headwinds as borrowing costs rise.
In the “Pause” phase, we often see both asset classes stabilizing. Historically, stocks have averaged a robust 16.1% return while bonds have posted an average positive return of 5.0%. This pause phase is particularly relevant today given the current set of economic circumstances, as we anticipate the Federal Reserve will hold back on further interest rate hikes.
During the “Cutting” phase, when the Fed reduces rates to stimulate the economy and bond prices tend to rise accordingly, bonds have rebounded strongly by posting a historical 8.4% average return. Stock prices are mixed but have shown a propensity to respond well, as lower interest rates often bolster economic activity and contribute to corporate earnings improvement.
At StrongBox Wealth, we find these historical patterns reassuring amid the current market landscape. The very high concentration of technology stocks represented in the S&P 500, while a point of caution, does not diminish the potential that these innovative companies hold and contribute to the global economy. We will be vigilant to monitor and recognize that the pace of innovation may also accelerate underlying risks of obsolescence, as shown in the chart comparing the Top 10 S&P 500 stocks today versus 10 years ago. Moreover, the bond market appears poised for price stabilization, while now providing fixed income investment yields that have not been this high in 15 years.
With the Federal Reserve signaling a potential pause in rate hikes, we are reminded of the historical performance during such periods. This pause stage may relieve some pressure on bond and stock prices by providing a more favorable environment for both.
through periods of challenging economic times and interest rate cycles. Our approach is designed to take advantage of the historical resilience and recovery patterns of these asset classes, ensuring that we remain aligned with clients’ long-term financial goals and in abidance with their underlying financial plans.
Wishing you and yours a happy, healthy, and restful holiday season. Thank you for your ongoing trust and confidence in StrongBox Wealth.
The views reflected in the commentary are subject to change at any time without notice. Nothing on this e-mail constitutes investment advice, performance data or any recommendation that any particular security, portfolio of securities, transaction or investment strategy is suitable for any specific person. Any mention of a particular security is not a recommendation to buy or sell that security. Strongbox Wealth manages its clients’ accounts using a variety of investment techniques and strategies, which are not necessarily discussed in the commentary. Investments in securities involve the risk of loss. Past performance is no guarantee of future results.This correspondence is solely for informational purposes. Advisory services are only offered to clients or prospective clients where StrongBox Wealth, LLC and its representatives are properly licensed or exempt from licensure. Past performance is no guarantee of future returns. Investing involves risk and possible loss of principal capital. No advice may be rendered by StrongBox Wealth, LLC unless a client service agreement is in place.
StrongBox Wealth LLC is registered as an investment adviser with the Securities and Exchange Commission (SEC). StrongBox Wealth LLC only transacts business in states where it is properly registered, or is excluded or exempted from registration requirements. SEC registration does not constitute an endorsement of the firm by the Commission nor does it indicate that the adviser has attained a particular level of skill or ability.